Dashboard
The dashboard provides a brief overview of the device status.
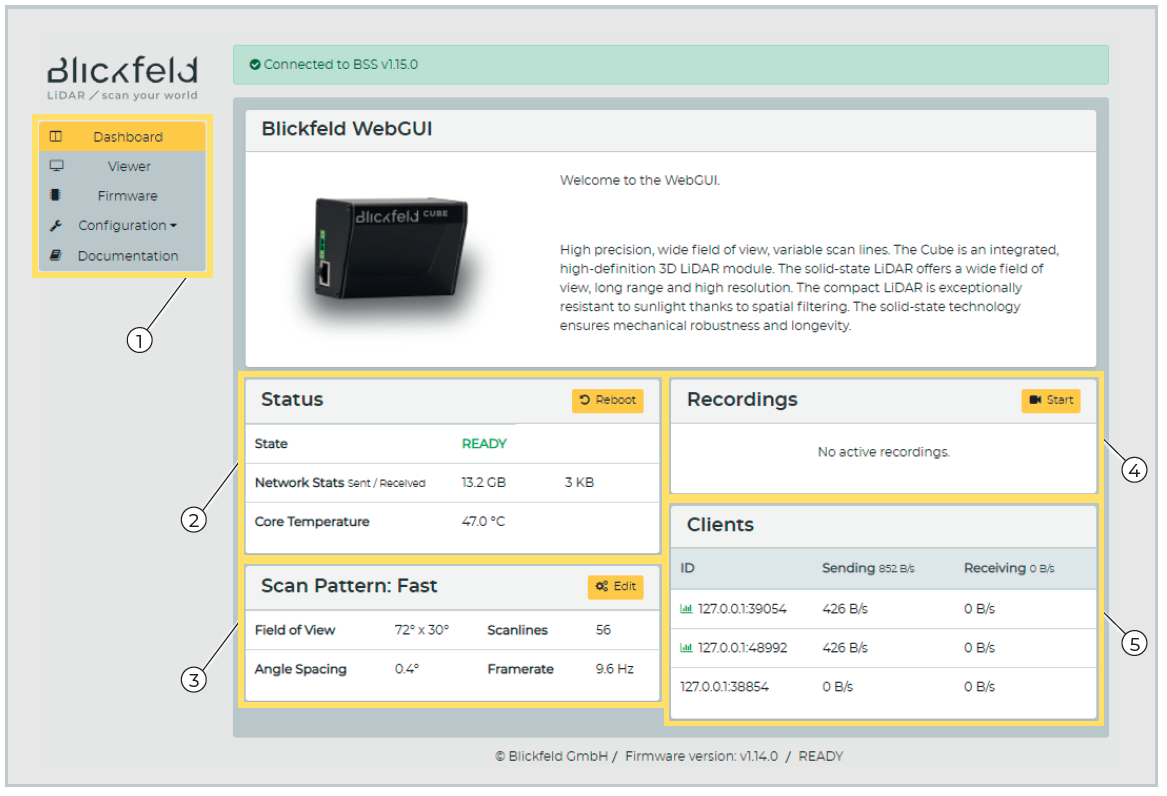
Menu
Status information:
Current state of the device. Details can be found at Scanner State.
Network Stats
Core temperature of the device
Reboot button (Reboot may take up to one minute)
Scan Pattern
Main parameters of the set scan pattern
Edit button
Number of connected clients with basic information
Active recordings and button to start a new one