Viewer
The embedded viewer displays point clouds. It can either show the live point cloud or replay a recording. The point cloud can be viewed freely from different angles and its appearance can be customized with different color schemes, which can be coded according to distance, intensity or other parameters. Furthermore, the viewer allows the convenient starting and stopping of point cloud recordings, which are saved on the host computer.
This video shows some configuration possibilites of the viewer and how to record pointclouds.
This video was recorded with the firmware 1.14.0.
Layout
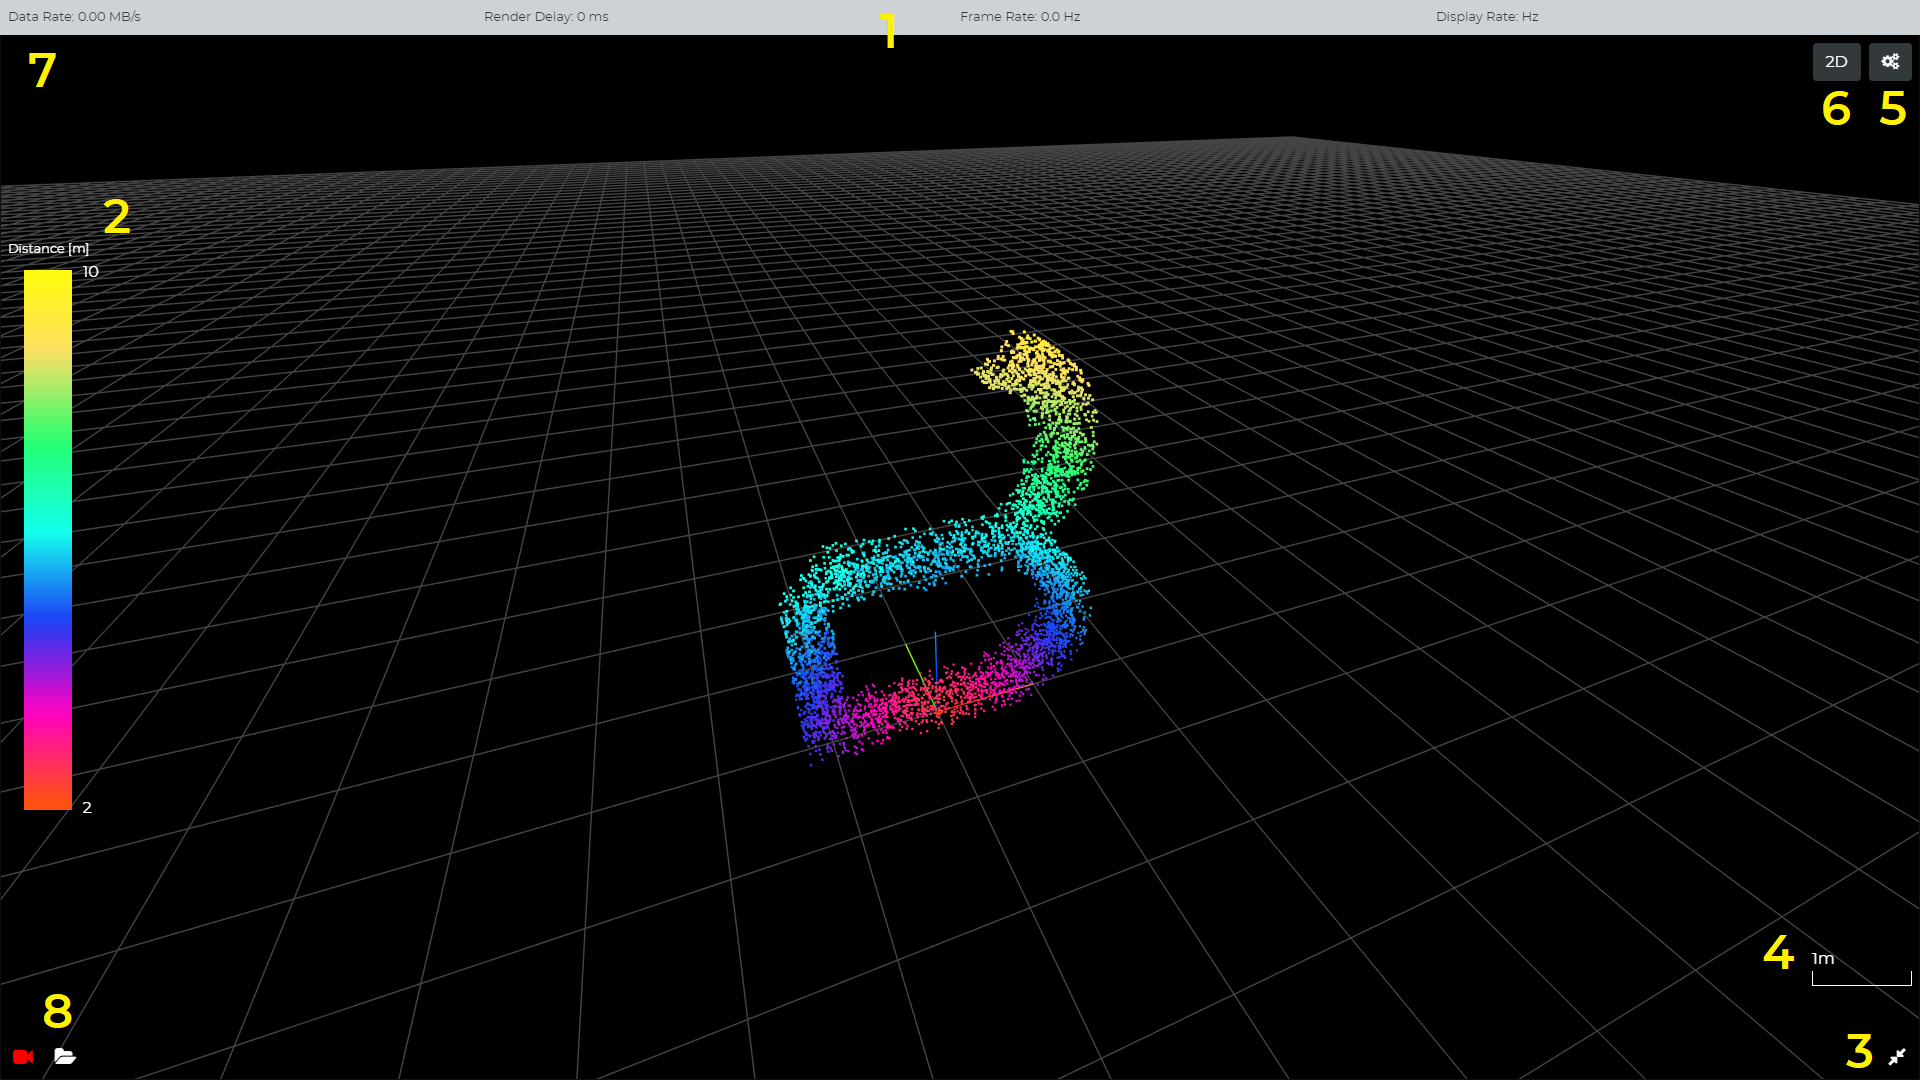
1) Performance Statistics
Metric |
Description |
|---|---|
Data Rate |
Amount of data received per second in megabytes. |
Render Delay |
Difference between current device time and start of frame timestamp, corrected by the estimated transmission delay. |
Frame Rate |
Amount of frames created by the scanner per second. |
Display Rate |
Amount of frames displayed per second. |
2) Currently selected color map
The color map on the left shows the color transitions in the currently selected color map. The numbers on the top and on the bottom next to the color map can be edited in order to modify the range of values covered by the color map. Values that are below the selected value range will be shown in the same color as the minimum value color. The same principle applies for values, which are above the selected value range.
4) Current grid cell size
The edge length of one grid cell in meters.
7) LIVE
Displays whether the point cloud is acquired live or whether a recording is replayed. If the viewer is replaying a recording, the name of the recording is displayed here.
Settings
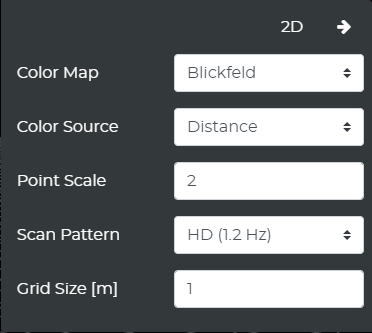
Color Source
The color source setting controls which data field is used for the color coding of the data points.
Option |
Description |
|---|---|
Distance |
Distance to origin (Default) |
X |
Position on x axis |
Y |
Position on y axis |
Z |
Position on z axis |
Intensity |
Intensity of the reflected laser light |
Ambient |
Ambient near-infrared light in the measurement direction |
The range of values covered by the color map is shown on the left side of the viewer. The values can also be changed there. When changing the color source, the range will automatically be set based on the current point cloud.
Color Map
This setting controls which color map is applied. Available Color Maps:
Blickfeld
Binary
Rainbow
Cool to Warm
Blackbody
Grayscale
Blue/Red Step
Point Scale
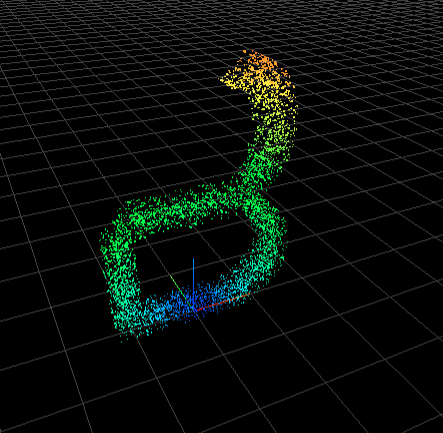
This setting controls the size of the points displayed in the point cloud. In the 3D view, the points are scaled additionally depending on the distance to the camera. In the 2D view, the points are all scaled to the same size.
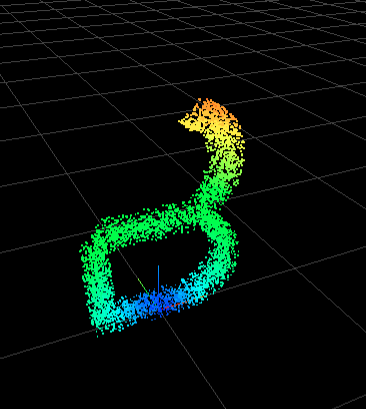
Example for point size 3:
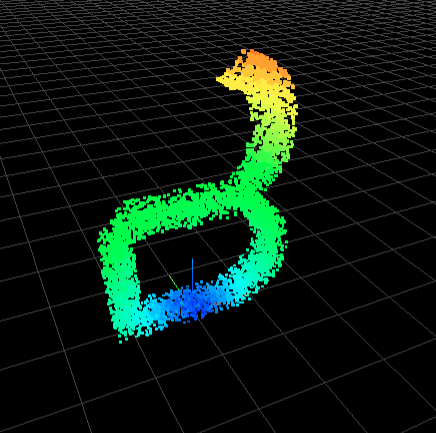
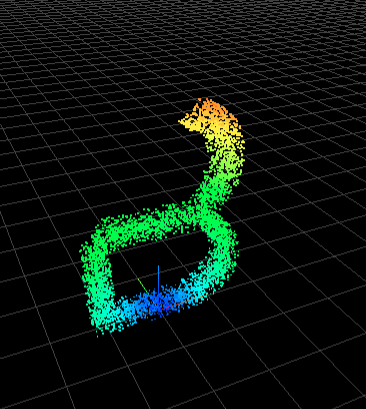
Example for point size 1:
Scan Pattern
Changes the scan pattern even during operation. Choose between several pre-defined scan patterns or use the configuration tab to create a new one.
Grid Size
Sets the size of one grid cell in meters.
Grid cell size 1 m:
Grid cell size 3 m: