Point Cloud Fetch
In this guide, a secure connection to a Qb2 device is established in order to fetch a point cloud frame, extract its point cloud data, and display it in a 2D plot.
| Please follow the Python Client Library Guide to install the Python package first. |
Fetching point cloud frames from Qb2
First a single point cloud frame, then a stream of frames is requested using the gRPC PointCloudblickfeld_qb2.core_processing.servicesqb2-xxxxxxxxx
Getting a single point cloud frame
The following example shows how to fetch a single point cloud frame using the get
import blickfeld_qb2

# Open a secure connection to Qb2
with blickfeld_qb2.Channel(fqdn_or_ip="qb2-xxxxxxxxx") as channel:
    service = blickfeld_qb2.core_processing.services.PointCloud(channel)

    frame = service.get().frame

    # Print the frame ID
    print("Received frame with ID:", frame.id)
Continuously streaming point cloud frames
The following example shows how to continuously stream point cloud frames from a Qb2 device.
import blickfeld_qb2

# Open a secure connection to Qb2
with blickfeld_qb2.Channel(fqdn_or_ip="qb2-xxxxxxxxx") as channel:
    service = blickfeld_qb2.core_processing.services.PointCloud(channel)

    # Request a point cloud stream from Qb2
    for i, response in enumerate(service.stream()):

        # Extract a point cloud frame from the response
        frame = response.frame

        # Print the frame ID
        print("Received frame with ID:", frame.id)

        # Get 3 frames and stop
        if i == 2:
            break
Getting the data from a point cloud frame
In the code snippet below, the Cartesian coordinates xyz
import numpy as np

# Get the x,y,z coordinates of the points in the frame
xyz = frame.binary.cartesian

# Calculate the azimuth and elevation
distance = np.sqrt(xyz[:,0] ** 2 + xyz[:,1] ** 2 + xyz[:,2] ** 2)
azimuth = np.arctan(xyz[:,0] / xyz[:,1])
elevation = np.arcsin(xyz[:,2] / distance)
Plotting a point cloud frame
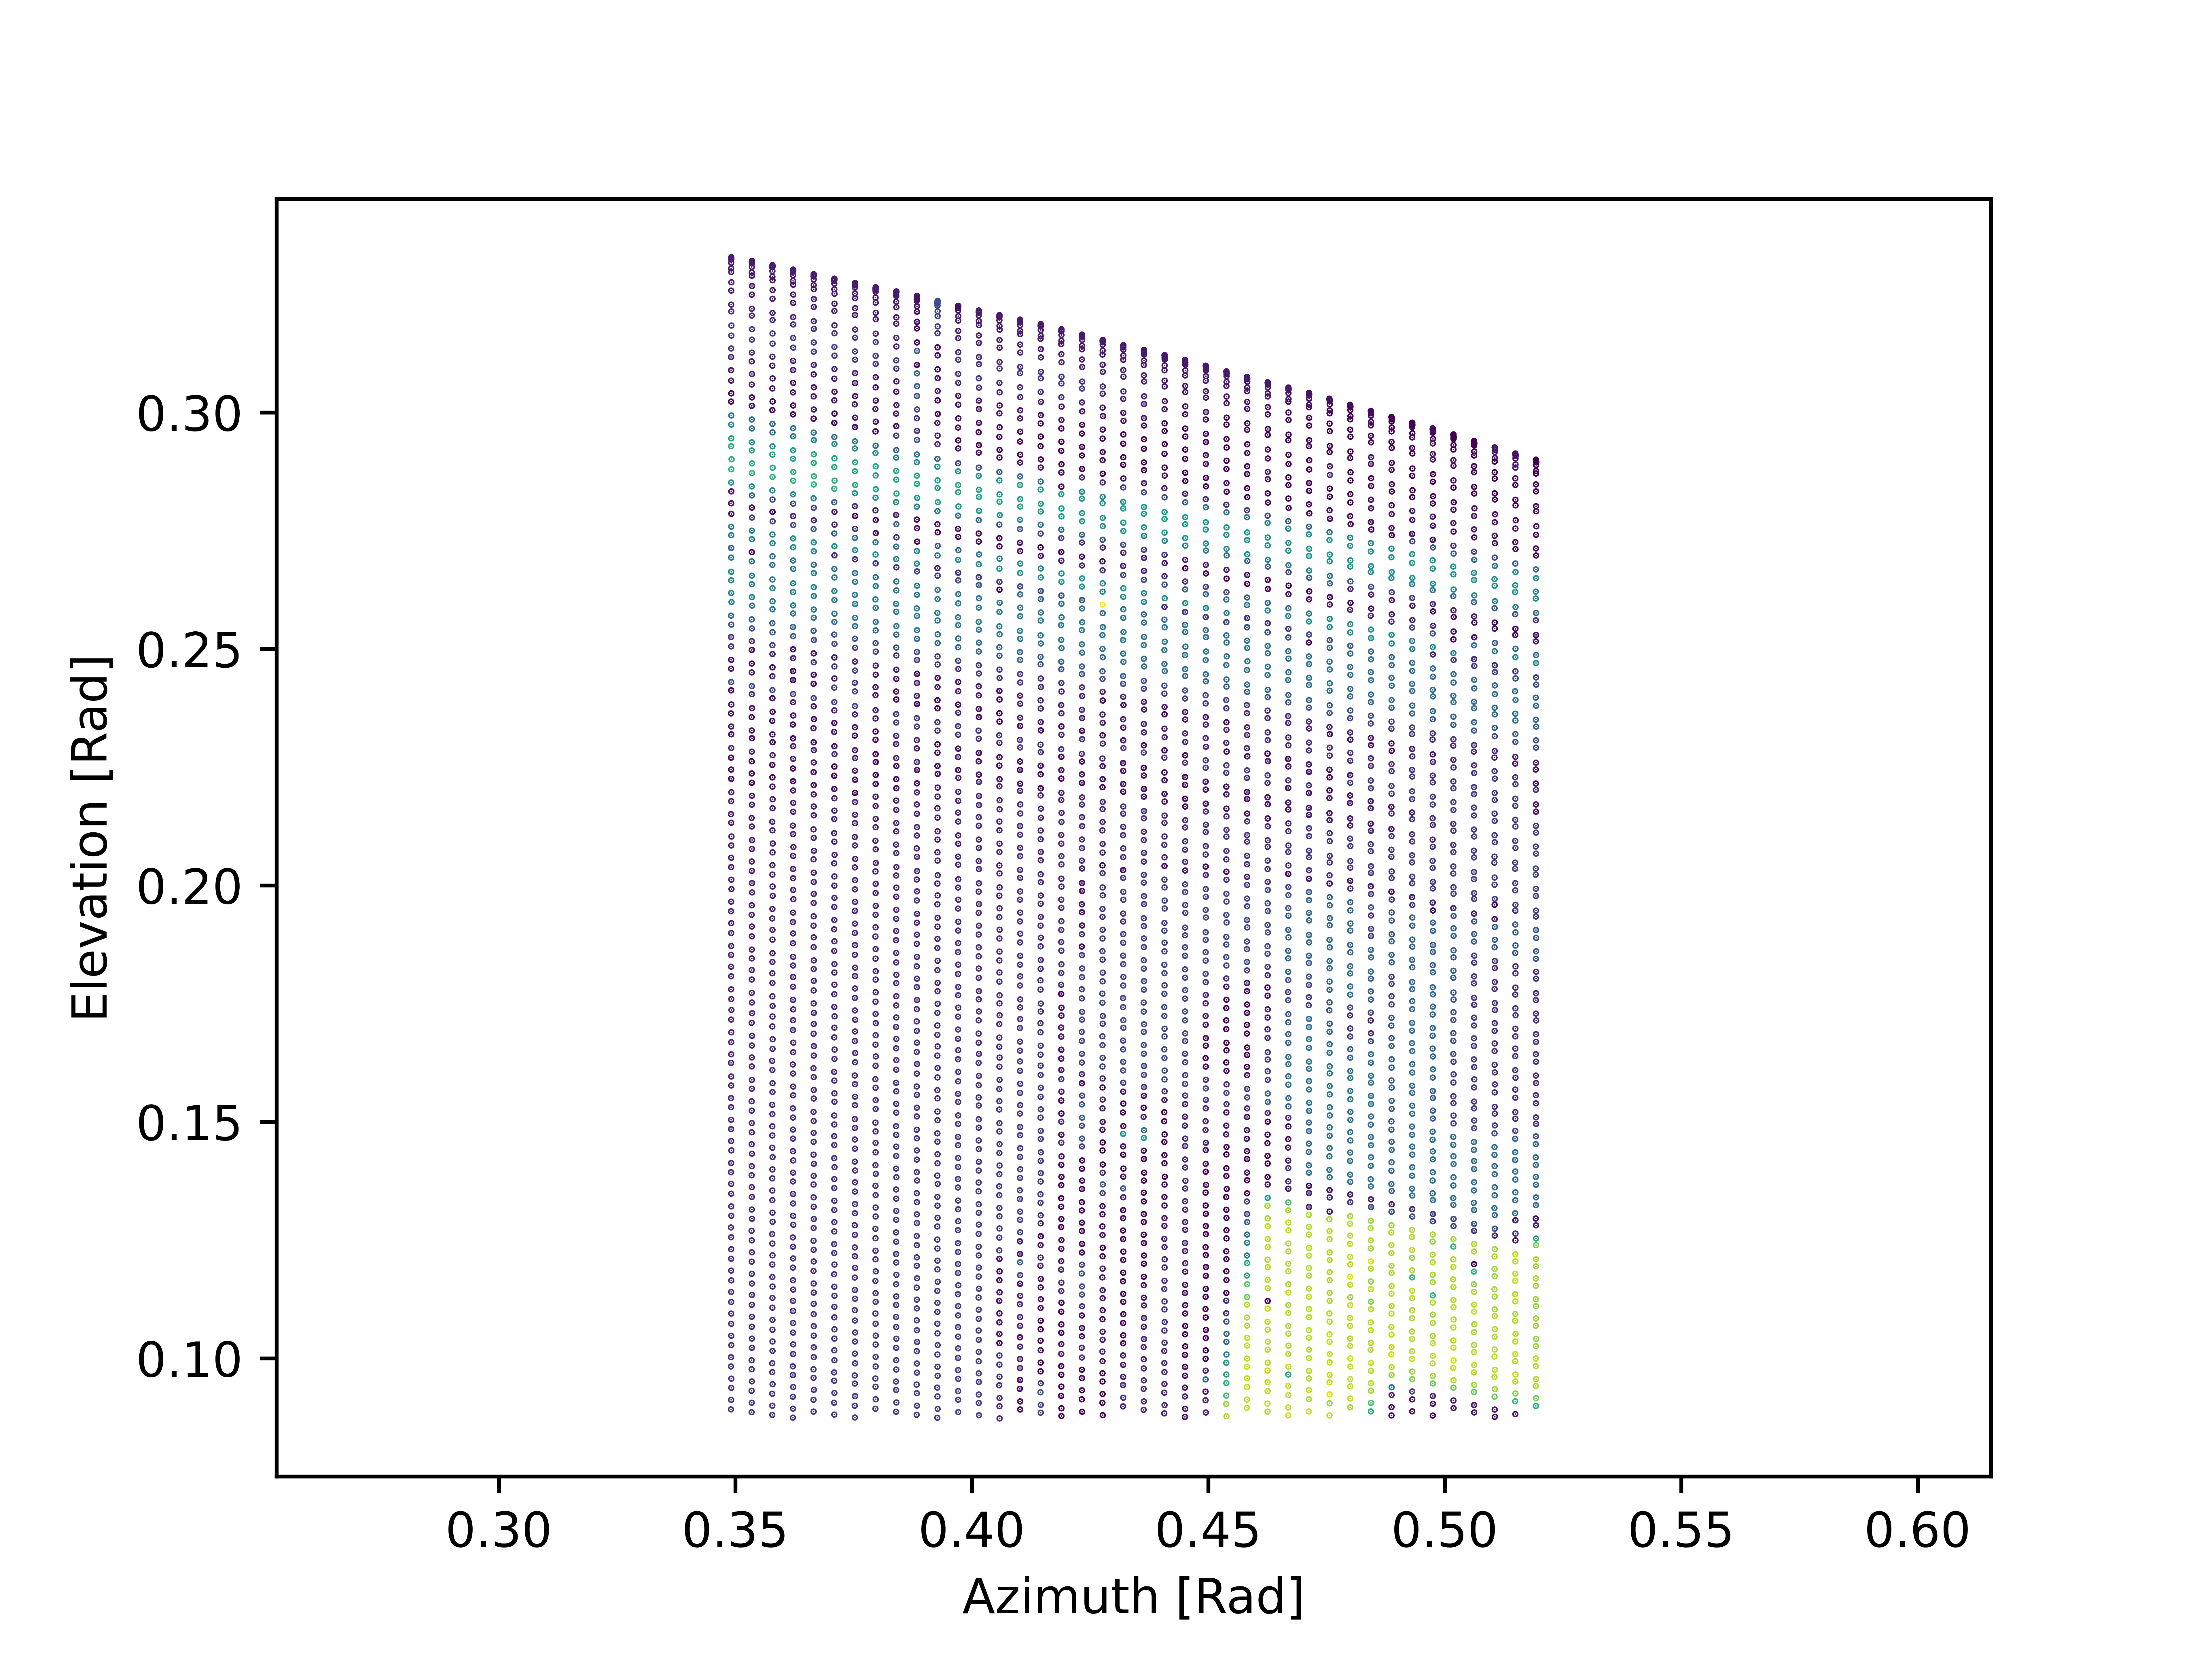
Finally, azimuthelevationphoton_count
import matplotlib.pyplot as plt

index = np.argwhere((azimuth > np.deg2rad(20)) & (azimuth < np.deg2rad(30)) & (elevation > np.deg2rad(5)))
plt.scatter(azimuth[index], elevation[index], c=frame.binary.photon_count[index], s=0.1)
plt.xlabel("Azimuth [rad]")
plt.ylabel("Elevation [rad]")
plt.show()
The plot result is shown in the figure below: