Visualize a Point Cloud using Open3D
In this guide, a point cloud is fetched from a Qb2 and visualized in Open3D.
| Please follow the Python Client Library Guide to install the Python package first. |
First, a point cloud frame is fetched from the sensor.
import blickfeld_qb2

# Open a secure connection to Qb2
with blickfeld_qb2.Channel(fqdn_or_ip="qb2-xxxxxxxxx") as channel:
    service = blickfeld_qb2.core_processing.services.PointCloud(channel)
    frame = service.get().frame
    # Print the frame ID
    print("Received frame with ID:", frame.id)
Then, the cartesian coordinates as well as the intensity of each point in the frame are extracted from the data structure.
import open3d as o3d
import numpy as np

# Create a point cloud object
pcd = o3d.geometry.PointCloud()

# Get the cartesian coordinates from the point cloud frame
pcd.points = o3d.utility.Vector3dVector(frame.binary.cartesian)

# Convert the intensity values to gray scale
# Note: Open3D expects RGB colors thus the same value is repeated for red, green, and blue.
pcd.colors = o3d.utility.Vector3dVector(np.repeat(frame.binary.photon_count / np.iinfo(np.uint16).max, 3).reshape((-1, 3)) * 20)
Finally, the point cloud is saved to file and visualized using Open3D.
# Save the point cloud to file
o3d.io.write_point_cloud("demo.pcd", pcd)

# Visualize the point cloud
o3d.visualization.draw_geometries([pcd])
Output:
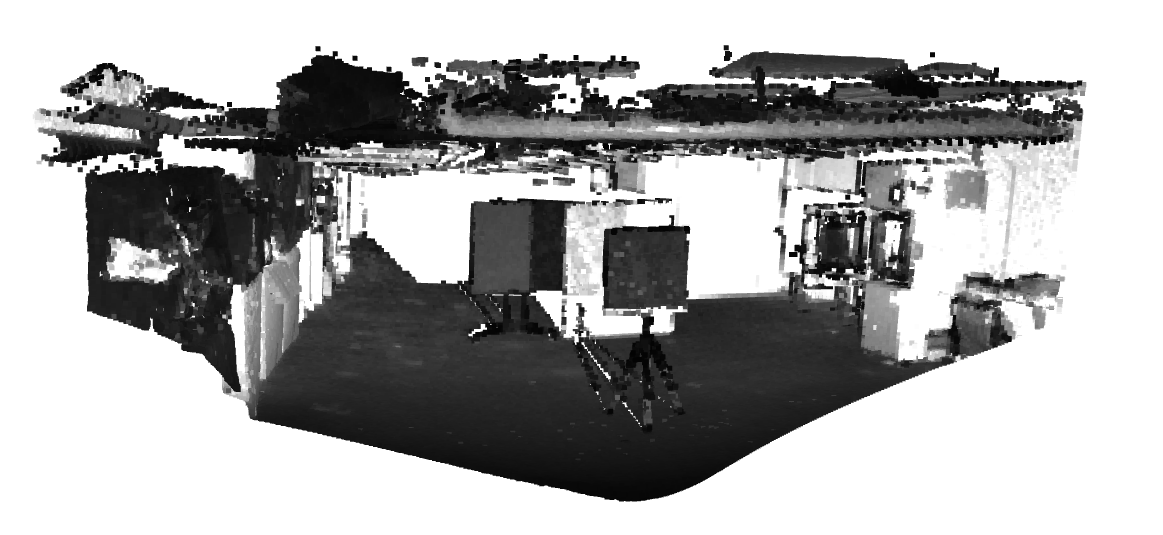
Figure 1. Visualization of the point cloud after manually adjusting the camera perspective